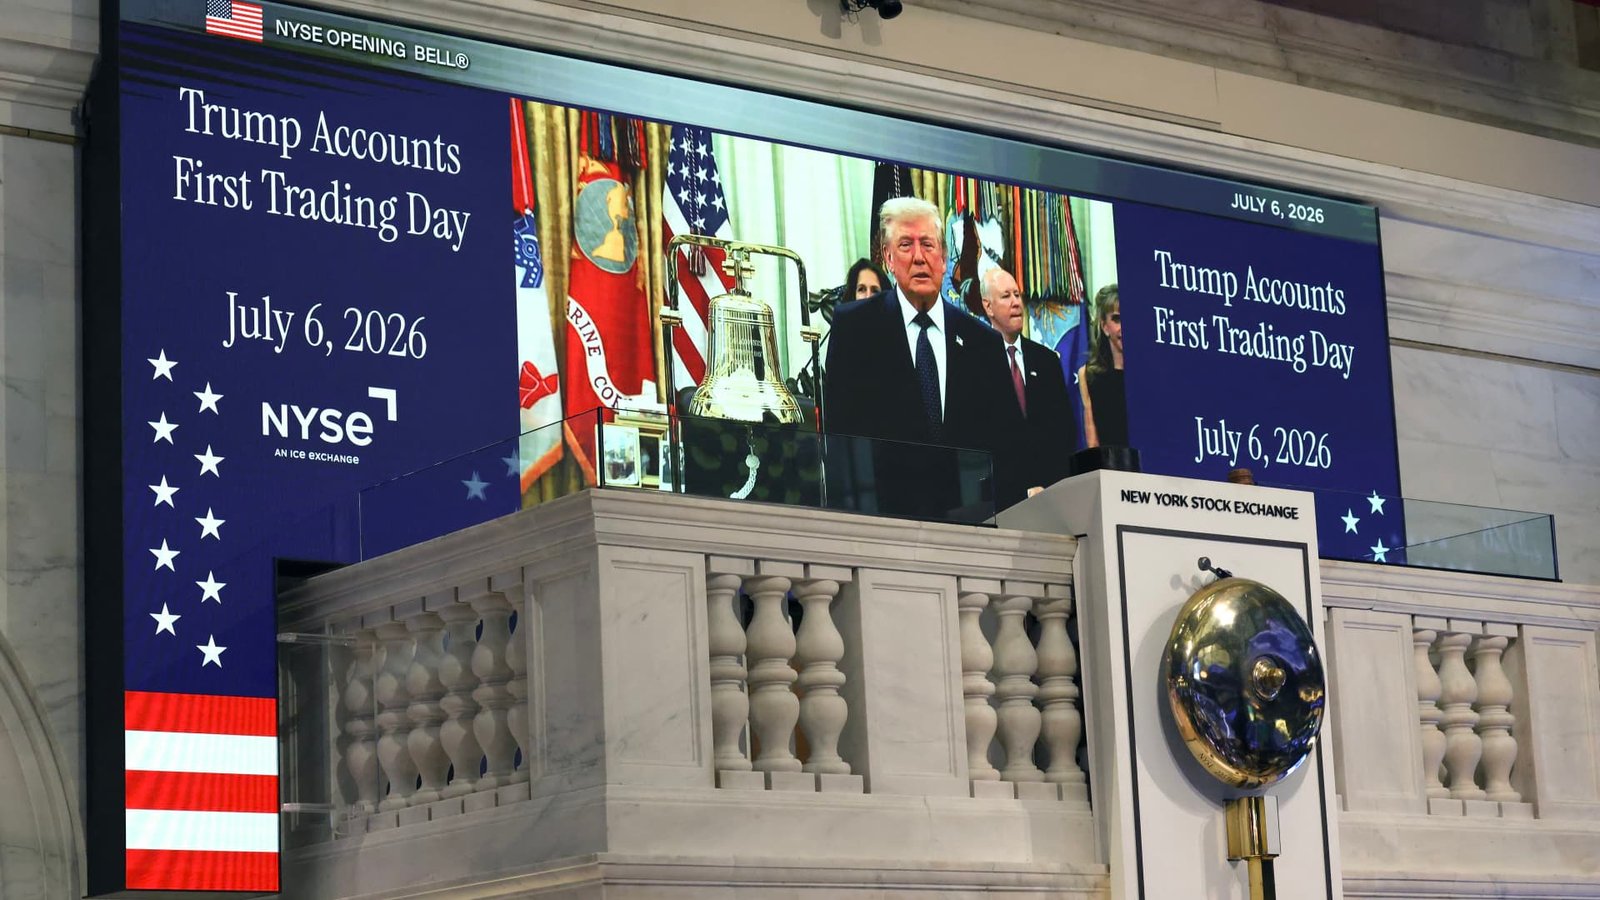









(This is The Best Stocks in the Market , brought to you by Josh Brown and Sean Russo of Ritholtz Wealth Management.) Josh — As of Friday’s close, approximately 68% of S & P 500 components were trading above their own 200-day moving average. That’s an extremely healthy tape and we love to see it. While the gains of 2026 have obviously been in tech stocks away from the “Magnificent Seven,” there’ve been winners in lots of areas of the market that garner less attention. Even in the laggard sectors. For today’s Monday edition of The Best Stocks in the Market, Sean wanted to take a look at some good stocks in bad sectors. If you think the second half of this year may not look quite like the first half, one strategy might be to put on exposure in lagging sectors for the next rotation. I’d rather buy strength in a group that hasn’t been working while paddling in front of that wave. We’re seeing strength in the charts of Merck (MRK) , Archer-Daniels-Midland (ADM) and State Street (STT) right now even as the rest of the pharma, food and asset management stocks trade weakly. These charts demand our attention. What are they saying? If these industry groups catch a bid, surely these are the stocks that could lead the charge. Here’s Sean with the high level stats and stories from the list. Andiamo. As of July 6, there are 207 names on The Best Stocks in the Market list. Top sector ranking: Top industries: Top 5 best stocks by relative strength: Sector spotlight: Rotation Since the S & P 500’s last all-time high, the market has been in constant churn. Memory stocks and semiconductors have been swinging 5%-10% in either direction on any given day. This pattern shows up clearly when you compare S & P 500 momentum against low volatility since the market topped in early June. If you zoom out, momentum is still trouncing low vol over every meaningful time period. But the past couple of weeks have been a different story. Tech, the biggest sector winner, is down 9%, while healthcare, the longtime laggard, is up a whopping 12%. Let’s take a look at some names on the list from underperforming sectors that are bucking the trend within their peer groups. Merck & Co., Inc. (MRK): Sean — Merck is the poster child for why healthcare became the forgotten sector. From 2023 through 2025, the stock returned a cumulative -5%. The market’s concern was logical: Keytruda, the best-selling drug in the world at more than $30 billion in annual sales, makes up nearly half of Merck’s revenue, and its patent expires in 2028. That’s what makes the price action this year so interesting. Price is telling us something the fundamentals are not. MRK is up about 14% YTD and closed at an all-time high on June 29 — while the company reported a $4.2 billion GAAP net loss in Q1. Merck took a $9 billion R & D charge from acquiring Cidara Therapeutics, part of a roughly $26 billion dealmaking spree over the past year (Verona Pharma for $10 billion, Cidara for $9.2 billion and a $6.7 billion deal for Terns Pharmaceuticals) — all aimed at building a pipeline to bridge the coming Keytruda gap. So things are cooking for this old healthcare stock and price is signaling that. Underneath the charges, the business is fine. Q1 revenue rose 5% to $16.3 billion, Keytruda grew 12% to $8 billion, and its animal health segment grew 13%. Merck raised 2026 revenue guidance to $65.8 billion–$67 billion and guided EPS to $5.04–$5.16. Strip out the one-time items, and the stock trades around 14x this year’s underlying earnings. Josh — Merck (MRK) spent close to a year and a half building a base in the high $70s to mid $80s before breaking out last November. That move carried the stock into the $120s, where it spent several months grinding between roughly $110 and $125, testing the top of that range more than once before finally clearing it. Buyers pushed the stock to a fresh all-time high near $130 in early July, and the level to watch now is whether that old resistance zone around $120 holds as support on any pullback. I think it will. RSI sits at 66, reflecting strong but not stretched momentum given the size of the recent move. We’re getting confirmation as price and momentum ratify each other at these new levels. This tells me the stock remains under accumulation at the highs. The stock wants higher. Traders can use $120, the top of that multimonth base, as a stop given how many times it was tested and defended before the breakout. Investors have more room to work with, with the 200-day near $107 serving as a longer-term backstop given how far the stock has climbed above it. Archer-Daniels-Midland Co. (ADM): Sean — Nobody screens for momentum and finds a grain processor (except for us). Yet here’s ADM, up roughly 29% YTD and 64% over the past year, in a sector that’s spent most of this bull market underperforming. ADM is one of the world’s largest agricultural processors — they buy corn, soybeans and wheat from farmers, then transport, store and process those crops into food ingredients, animal feed, sweeteners and ethanol. Q1 revenue was $20.5 billion with adjusted EPS of $0.71, but the forward guidance is where the juice is. Management raised full-year adjusted EPS guidance to $4.15–$4.70, up from $3.60–$4.25, helped by new federal biofuel blending requirements and soybean oil prices at their highest levels in more than three years. A multiyear cost program targeting $500 million–$750 million in savings is still ahead of us as well (thanks AI). Lastly, ADM paid its 377th consecutive quarterly dividend in Q1, yielding 2.7%. That’s over 94 years of uninterrupted payments. The stock trades around 18x forward earnings, and the next catalyst is the Q2 report in early August, where the Street is looking for EPS up nearly 39% year over year. Josh — We’ve pulled back from the highs but the uptrend is still intact for ADM. The stock took less than a year to run from a $50 low last August to a high near $82 in June. It has since slipped just below its 50-day moving average, now sitting around $77, a spot worth watching closely since a clean break lower would open the door to a retest of the spring consolidation zone in the low $70s. RSI has cooled to 46, down from readings near 70 earlier in the rally, showing momentum has faded from the highs. That reads as a normal reset after a sustained advance rather than a reversal signal, as long as prior support holds. Traders can watch the recent low near $74, the shelf that formed during the last pullback, as a tight stop. Investors have room to lean on the 200-day moving average near $67, which lines up closely with the base the stock built earlier this year before the rally accelerated. I like this one better as an investment than a trade for now. State Street Corp. (STT): Sean — On Wednesday, the Treasury Department announced that every dollar contributed to Trump Accounts, the new national savings program for children that launched July 4 — will be invested by default in a single fund: the State Street SPDR Portfolio S & P 500 ETF (SPYM). Four other funds will eventually be added to the menu, but at launch, State Street is the only game in town. That headline landed with a business already outperforming its peers. Over the last year, STT is up 60% while the XLF is up a meager 7%. Q1 was a record quarter, total revenue rose 16% year-over-year to $3.8 billion, fee revenue grew 15%, net interest income rose 17%, and FX trading revenue surged 29% on record client volumes. EPS excluding notable items came in at $2.84, up 39%, with pre-tax margin expanding 400 basis points. AUM grew 20% to $5.6 trillion on record ETF inflows. All bull market numbers. Management raised full-year fee revenue growth guidance to 7–9% (from 4%–6%) and now expects net interest income growth of 8%–10%. State Street also announced plans to raise the dividend 10% to $0.92 per share in Q3, with buybacks continuing alongside it. Be aware that Q2 earnings land July 16. Josh — State Street (STT) broke out of a long base between $120 and $130 last spring and ran to an all-time high near $175 by late June. This is notable given the juxtaposition with the falling alternative asset management stocks all year. The stock has eased slightly since then to around $171, a normal pause after such a steep run, and the level to watch is whether that old $130 breakout zone holds if the pullback extends. To Sean’s point, we’ll get an earnings report 10 days from now and the stock’s reaction could make or break the trade. RSI reads 62, still firmly on the bullish side of neutral but well off the overbought extremes the stock flashed earlier in the rally. Momentum remains constructive without being stretched. Traders and investors can both use the 50-day moving average near $159 as a working stop, since it has held up as reliable support through the entire advance. I don’t want to be in this thing below $150 as this would mean the uptrend has officially been broken. DISCLOSURES: (None) All opinions expressed by the CNBC Pro contributors are solely their opinions and do not reflect the opinions of CNBC, or its parent company or affiliates, and may have been previously disseminated by them on television, radio, internet or another medium. THIS CONTENT IS PROVIDED FOR INFORMATIONAL PURPOSES ONLY AND DOES NOT CONSTITUTE FINANCIAL, INVESTMENT, TAX OR LEGAL ADVICE OR A RECOMMENDATION TO BUY ANY SECURITY OR OTHER FINANCIAL ASSET. THE CONTENT IS GENERAL IN NATURE AND DOES NOT REFLECT ANY INDIVIDUAL’S UNIQUE PERSONAL CIRCUMSTANCES. THE ABOVE CONTENT MIGHT NOT BE SUITABLE FOR YOUR PARTICULAR CIRCUMSTANCES. BEFORE MAKING ANY FINANCIAL DECISIONS, YOU SHOULD STRONGLY CONSIDER SEEKING ADVICE FROM YOUR OWN FINANCIAL OR INVESTMENT ADVISOR. Click here for the full disclaimer.
These are the best stocks in the worst sectors for investors betting on a rotation